The power of Desmos

Last year I posted about how we could replace the ti-83 calculators with Geogebra because of the ability to have multiple screens open and be able to do more regression models.  I am not discrediting Geogebra, but I feel that Desmos has been great because of it’s ability to be used on multiple platforms.  This year Desmos has come out with the ability to also complete these regressions and combine it with the original power of Desmos, manipulating in real time.

Having students able to use Desmos on their phone, a school iPad, or a school computer/laptop has been vital for our investigations as we do not have a one to one ratio of tech to student.  It was also great to hear some of the students say “Oh, so I can do this at home?” Also seeing them use their phone for a productive app has been a good transition from all simple games they like to play instead.

I have not used it for all the regression models, but found that it worked really well with teaching about a line of best fit to the grade 9 academic class.  They were told vaguely to graph a line that best fits the data and then we compared it to the one Desmos created.  The students then created the (correct) rules for applying a line of best fit to any model.  It was a great visual to see that it did not have to pass through the origin, and that it does try to place an equal amount of points above and below the line.

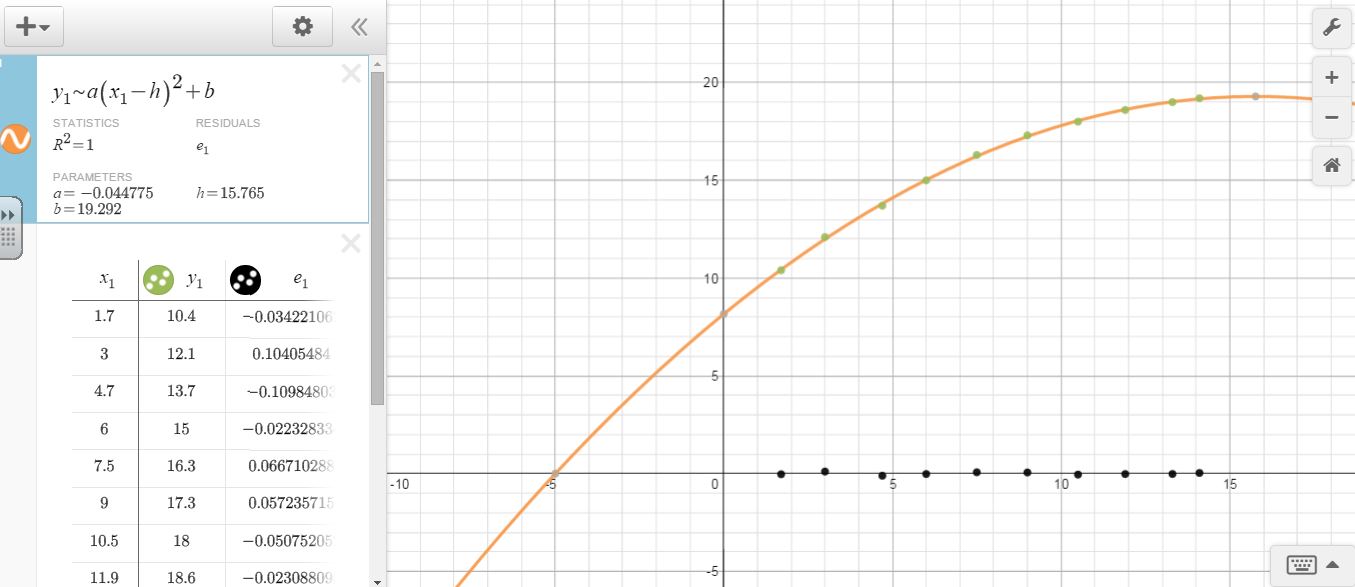
Below I have some samples of what it looks like to have the regression models.  I was able to copy data straight from google sheets which was very efficient and easy instead of typing data.

I have also started using it for investigations with linear relations and so far it has helped students with manipulation of the information and visual representations. It is a learning curve as most are used to having information presented to them and then complete the tasks with their new information.

Linear Regression

Quadratic Regression

Exponential Regression

Replacing TI 83 with Chrome Apps

In the past unit I taught on graphical models, the course focused on regression modelling using the TI-83 Graphing Calculators.  Having used them myself during my high school education I was initially excited for the chance to use them in my own classroom.  Unfortunately it was short lived when I went to the GAFE Summit and I decided to use the Chromebooks and the app Geogebra.

The first day I brought the Chromebooks into the classroom my students were slightly confused on how a math class could use the same technology they used in English and the Humanities.  I introduced the program, created a help guide with Google Docs that they could access, and walked them through the new piece of technology (while assuring them that I was still a beginning user so we were learning together).  After the class ended a lot of discussions arose about the unfamiliarity of the program and how some wanted to use the graphing calculators even though they did not fully enjoy those either.

After the third time we used the tech students who “mastered” the steps were able to help their classmates who did not fully understand how to produce the various regression models.  To my delight students were more appreciative of the new tool they were provided and even found that their resilience was paying off.  Great discussions in the class began about which model to use based on the situation and the R Squared value.  I will admit I was delighted that this was working well and I began to share my new knowledge to my coworkers.

Students wrote their test and instead of the smiling faces or confident submissions I was expecting I found that students were confused and were very upset about their potential mark.  I spoke to some students after the class to understand why they were not very happy with the way the assessment went and their responses initially shocked me.  “We felt like we could produce the graphs and describe them, but we could not describe a graph that was provided for us”.  I thought through the unit and looked at my plans only to realize that I focused a lot of the lesson on being able to use the tech and not as much time as needed on understanding the outcome.

As a first year teacher I realized that I fell into the bad trap of getting lost in the new tech and unfortunately created students who could follow steps instead of thinkers.  One thing that I think will help me in my next attempt at using this is writing out a pros and cons list and a next steps list.  I also started tracking what points students had difficulty with so I can prepare for these in future classes.

My question to those of you reading it is how do you prepare your students to be clearer thinkers rather than students who follow steps? (and this example above was a college level class that I am looking at helping develop deeper understanding)